


If you’re running a small business, chances are you’re pouring money into marketing every month without a clear picture of what’s actually working. You post on social media, run a few ads, maybe send some emails, but when someone asks, “What’s your return on that spend?” you’re stuck guessing. This is exactly why every growing business needs a small business marketing dashboard.
A marketing dashboard isn’t just a fancy spreadsheet. It’s a centralised view of the numbers that tell you whether your marketing dollars are generating leads, customers, and revenue, or just disappearing into the void. Without one, you’re flying blind, reacting to gut feelings instead of data.
Not sure where to start? Keep reading to learn exactly which monthly marketing KPIs to track and how to set up your first small business marketing dashboard in under an hour.
Why Small Businesses Need a Marketing Dashboard
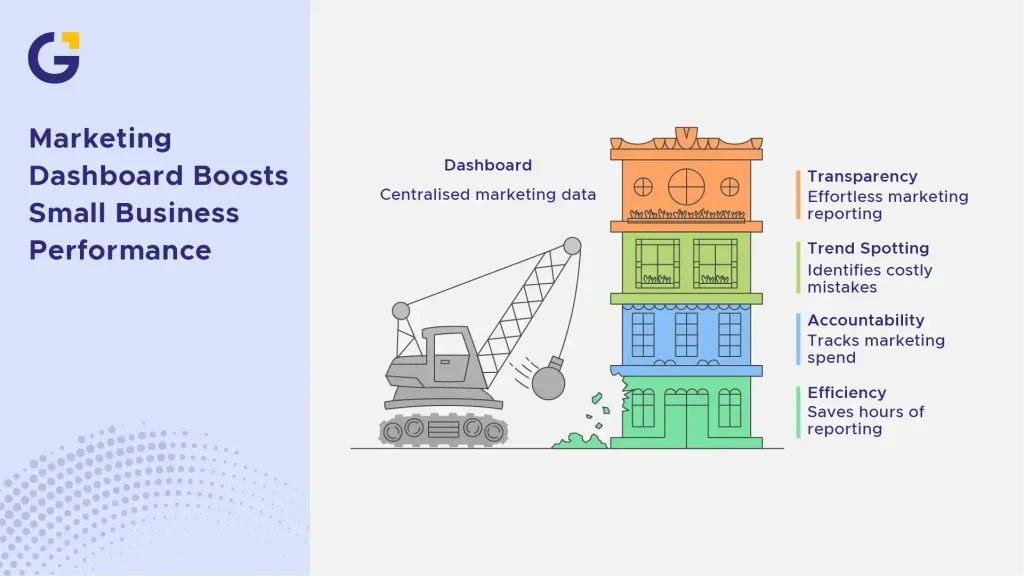
Most small business owners wear ten different hats. You don’t have time to log into five different platforms just to figure out how your campaigns are performing. A dashboard solves this by pulling all your key data into one place, updated automatically.
It also creates accountability. When you know exactly what to measure in marketing performance, it’s much harder for marketing spend to quietly slip away without results. As Dharmesh Shah (Co-founder of HubSpot) often emphasises, tracking the right growth metrics is what separates businesses that scale predictably from those that struggle.
Example Case: A local HVAC company was spending $1,500 monthly on Google Ads but had no idea which keywords brought in actual customers. After building a simple dashboard, they discovered 60% of their budget was going to searches that never converted. They reallocated that spend and cut their cost per lead by nearly half within two months. (To avoid similar waste, check out our guide on Common PPC Mistakes Australian Businesses Make).
- Centralises data from multiple platforms into one clear view.
- Helps you spot trends before they turn into costly mistakes.
- Makes marketing reporting for small businesses effortless and transparent.
- Saves hours of manual reporting every month.
Key Marketing KPIs to Track Every Month
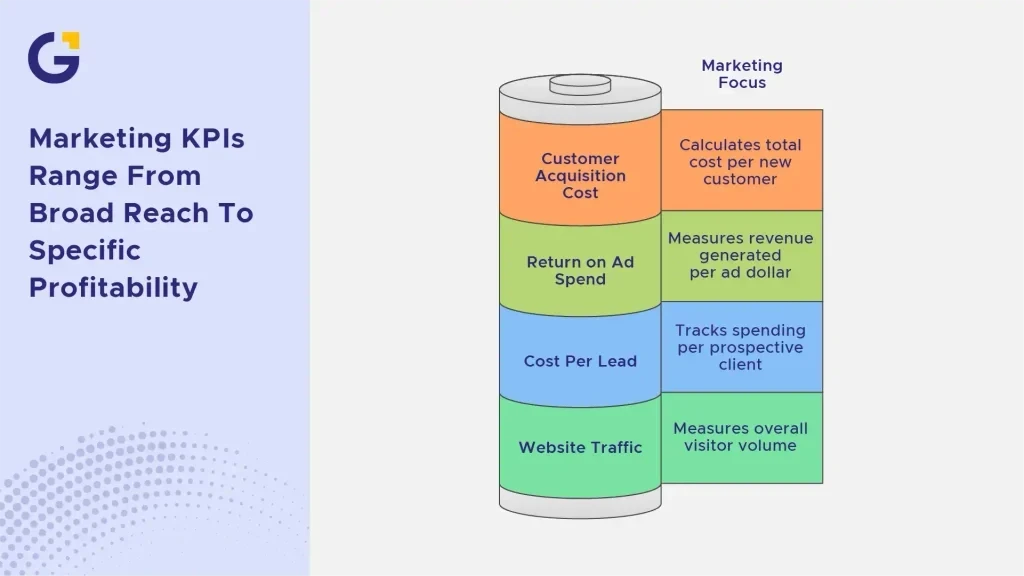
Not every metric deserves your attention. Focusing on the right KPIs to track monthly keeps your dashboard clean, useful, and easy to act on.
Website Traffic and Sources
Traffic tells you how many people are finding your business, but the source is what matters most. Organic search, paid ads, social media marketing, and referrals all behave differently.
Tracking sources helps you double down on what’s actually driving visitors, rather than spreading your budget evenly across channels that may underperform. If you want to dive deeper into multi-channel growth, read our breakdown on SEO vs Google Ads for Sydney Small Businesses: Which One Gives Faster ROI in 2026?.
Conversion Rate
This is the percentage of visitors who take a desired action, whether that’s filling out a form, making a purchase, or booking a call. A high traffic volume means nothing if your conversion rate is low.
Example Case: An online boutique had 10,000 monthly visitors but only a 0.8%% conversion rate. After identifying a broken checkout flow through their dashboard, they raised conversions to 2.1% without spending an extra dollar on ads. Learn more about fixing these issues in our guide on Conversion Rate Optimisation (CRO) Strategies for Australian Websites.
Cost Per Lead (CPL)
Cost per lead shows exactly how much you’re spending to generate a single prospective client. This metric allows you to compare channels fairly, as a “cheap” campaign is useless if it yields poor-quality leads. For proven conversion tactics, review these 10 Lead Generation Strategies that Work for Sydney.
Return on Ad Spend (ROAS)
ROAS measures the revenue generated for every dollar spent on advertising. According to benchmarks published by Search Engine Journal, maintaining an accurate view of ROAS is crucial for scaling paid acquisition. A ROAS of 4:1 means you earn four dollars for every dollar spent—a vital benchmark for justifying ongoing ad investment.
Customer Acquisition Cost (CAC)
CAC calculates the total cost of acquiring a new paying customer, including ad spend, tools, and labour. Comparing CAC to Customer Lifetime Value (LTV) tells you whether your overall business strategy is profitable over the long term.
Tools You Can Use to Build a Marketing Dashboard
You don’t need expensive enterprise software to get started. Several accessible tools can help you build a small business marketing dashboard that pulls live data automatically.
Google Looker Studio
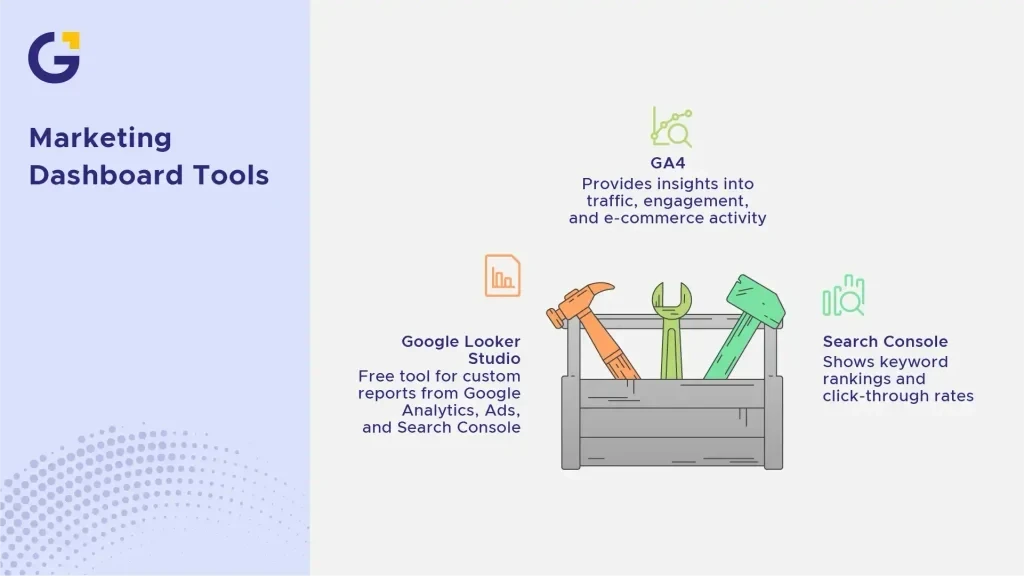
Google Looker Studio (formerly Google Data Studio) is a free tool that connects directly to Google Analytics, Google Ads, and Search Console. It allows you to create custom, visual reports without technical coding skills.
Example Case: A boutique agency used a Looker Studio template to automate client reporting, cutting their monthly reporting workload from six hours down to under 30 minutes.
GA4 and Search Console
GA4 provides detailed behavioural insights, including traffic sources, user engagement, and e-commerce transactions. Google Search Console adds search intelligence, showing keyword rankings and click-through rates. Together, they form the core infrastructure of modern AI SEO and reporting dashboards.
How to Build Your First Marketing Dashboard
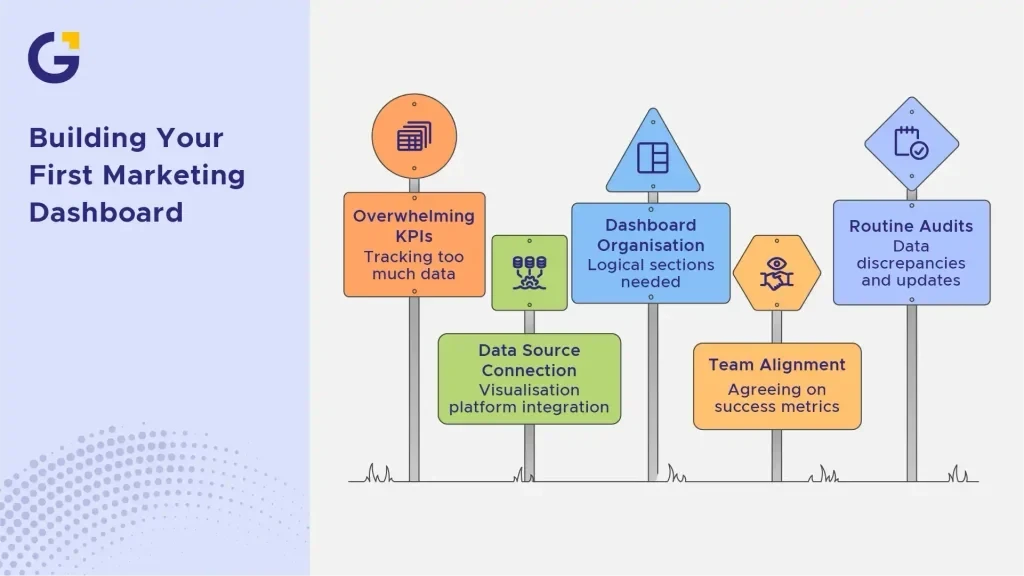
Start by identifying your three to five most critical KPIs; don’t overwhelm yourself by tracking everything at once. Next, connect your primary data sources (GA4, Google Ads, email marketing platforms, and CRM) to a visualisation platform like Looker Studio.
Once connected, organise your dashboard into logical sections: traffic channels, lead conversions, acquisition costs, and total revenue. Review the layout with your sales and management teams to ensure everyone agrees on what success looks like.
To keep your dashboard effective, schedule a routine monthly audit. Check for data discrepancies, update your target benchmarks, and adjust your tracking whenever you launch new campaigns or redesign your website. If you’re planning a site refresh, follow our checklist on 5 Critical SEO Mistakes Sydney Businesses Make During a Website Redesign to ensure your tracking codes and analytics remain fully intact.
How Often You Should Review Your Dashboard
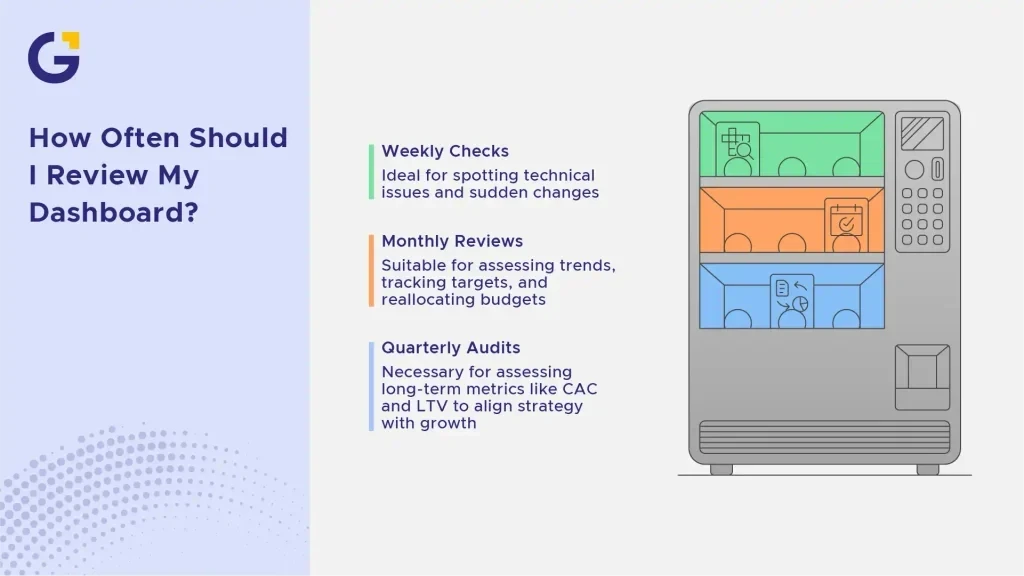
While your small business marketing dashboard updates in real time, checking it constantly can lead to overreacting to daily fluctuations. For most small-to-medium businesses, a weekly check-in combined with a comprehensive monthly review hits the sweet spot.
- Weekly Checks: Look for sudden technical anomalies, such as broken conversion forms, sudden ad spend spikes, or tracking code failures.
- Monthly Reviews: Evaluate high-level KPI trends, compare performance against monthly targets, and reallocate budget toward top-performing channels.
- Quarterly Audits: Assess long-term metrics like Customer Acquisition Cost (CAC) and Customer Lifetime Value (LTV) to align your strategy with overall business growth. (Need a broader evaluation? Work through our Digital Marketing Audit Checklist for Sydney Small Businesses).
Frequently Asked Questions
1. What is a small business marketing dashboard?
A small business marketing dashboard is a centralised visual reporting tool that aggregates real-time data from various platforms (like Google Analytics, Meta Ads, and CRM systems) into a single screen to monitor key marketing metrics.
2. Which KPIs are most important for small businesses to track?
While priorities vary by industry, the most essential monthly metrics include Website Traffic by Source, Conversion Rate, Cost Per Lead (CPL), Return on Ad Spend (ROAS), and Customer Acquisition Cost (CAC).
3. Can I build a marketing KPI dashboard for free?
Yes. Tools like Google Looker Studio allow you to connect free data sources like GA4 and Google Search Console to create professional, automated marketing dashboards at zero cost.
4. How does a marketing dashboard improve marketing ROI?
By providing clear visibility into which channels generate profitable leads and which waste budget, a dashboard enables data-driven decisions that lower cost-per-acquisition and increase overall return on investment. Read more in our guide on how to improve marketing roi in Australia.





 3 Jul 2026
 19 Min Read